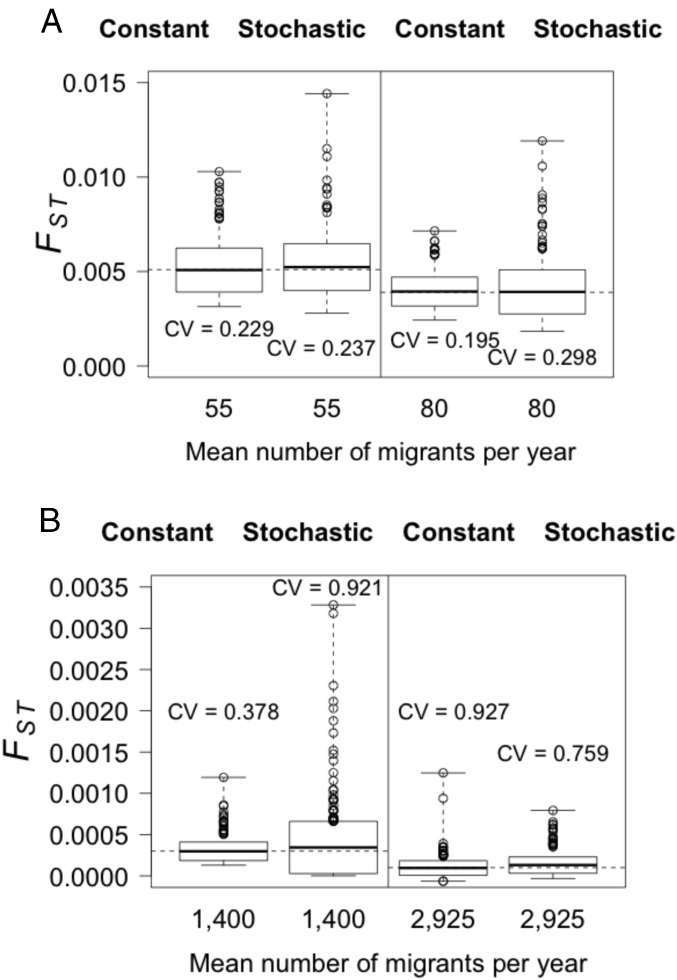
Fig. 4.
Boxplot of genetic differentiation (FST) resulting from constant vs. stochastic migration for North Sea vs. (A) inner fjord and (B) outer coast simulations. Migration was tested at the same levels of migration, and migration rate relative to the recipient population m, that base case parameterizations estimated to be the upper and lower levels of migration: 55 (m = 1.6%) and 80 (m = 2.3%) for the North Sea vs. inner fjord and 1,300 (m = 14.7%) and 2,800 (m = 30.8%) for the North Sea vs. outer coast.

