Fig. 4.
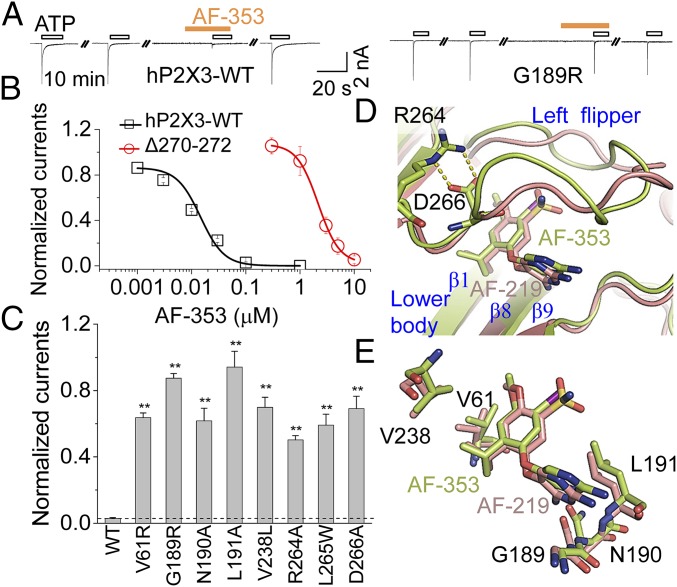
Comparison between AF-353 and AF-219 bindings to hP2X3. (A) Representative traces of AF-353 (0.1 µM) effects on ATP (10 µM)-evoked currents of hP2X3-WT and its G189R mutant. (B) Concentration−response curves for AF-353 of hP2X3-WT and Δ270 to Δ272 (n = 3 to 4). Solid lines are fits to Hill equation. (C) Effects of AF-353 (0.1 µM) on ATP (10 µM)-evoked currents of hP2X3-WT and selected mutants affecting the identified allosteric site (mean ± SEM, n = 3 to 5). **P < 0.01 vs. WT (dashed line), Student’s t test. (D) A close-up view of superimposed hP2X3 models with AF-219 (deep salmon) or AF-353 (lemon). hP2X3 and allosteric small molecules are depicted by cartoon and stick models, respectively. (E) Superimposed key residues of hP2X3 that make contacts with AF-219 (deep-salmon) and AF-353 (lemon).

