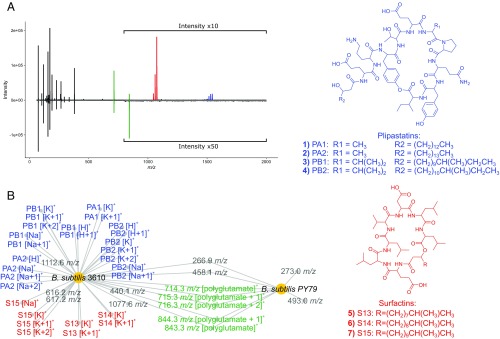
Fig. 1.
Analysis of MALDI-TOF MS specialized metabolite data from two B. subtilis genetic variants (10 technical replicates each) shows distinct differences in plipastatin and surfactin analog production. (A) Inverse spectrum comparison showing representative spectra for B. subtilis 3610 (positive spectrum) and B. subtilis PY79 (negative spectrum). (B) MAN showing the differential production of surfactin and plipastatin antibiotic analogs between the two strains. Large nodes represent individual bacterial colonies, while smaller nodes represent individual m/z values in MALDI-TOF spectra that fall within our peak selection criteria. MALDI-TOF spectrum annotations can be found in SI Appendix, Fig. S1. Isotopologues are denoted as +1, +2. Based on their precedence in B. subtilis 3610 and PY79 in literature, we assigned several m/z peaks as polyglutamate-like polymers (22). The remaining peaks were not identified but may represent primary metabolites and/or yet-to-be-characterized specialized metabolites. Importantly, we assigned 33/42 m/z values (78.6%), providing evidence that the MAN is primarily composed of specialized metabolites.

