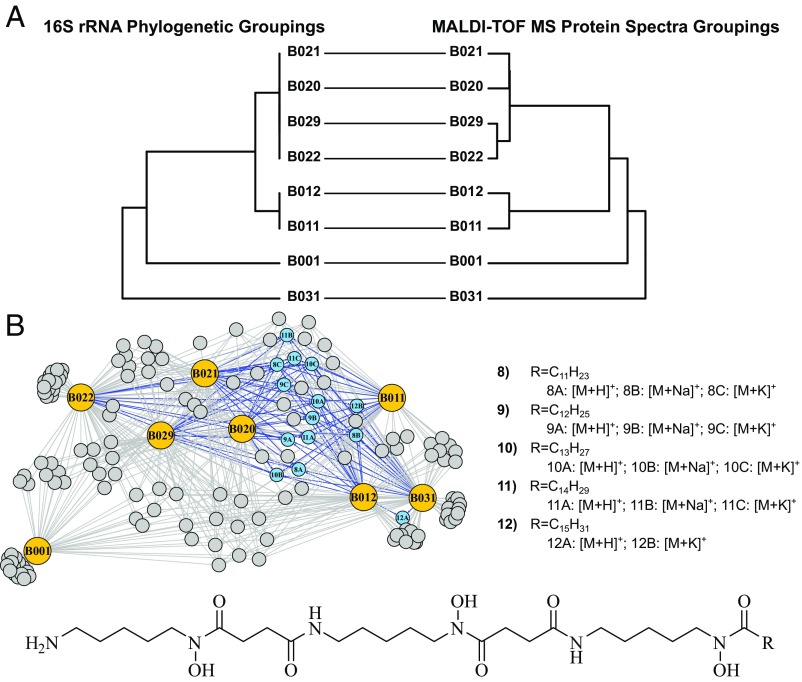
Fig. 2.
IDBac protein and specialized metabolite analysis of isolates from a single Micromonospora species. (A) Tanglegram depicts a high degree of similarity between groupings of 16S rRNA gene sequence identity and MALDI-TOF MS protein data of M. chokoriensis isolates. (B) MAN of MALDI-TOF MS data from M. chokoriensis colonies highlights distinct intraspecies differences in specialized metabolite production; this is due to differential production of a specific series of acylated desferrioxamine siderophores (shown as blue nodes), which B001 did not produce.

