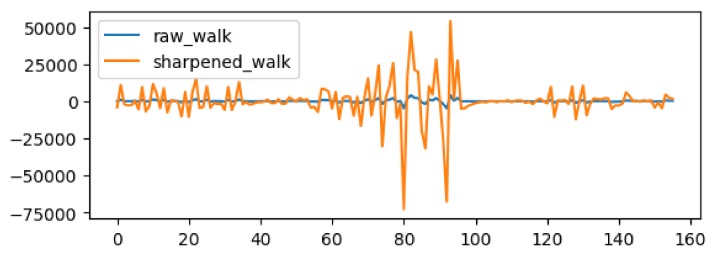
Figure 5.
A sample activity data describing walking activity. Each number in the horizontal axis indicates various statistical features such as mean, standard deviation, minimum and maximum calculated from a fixed length time series data collected from multiple sensors. The blue line indicates data before sharpening and the orange line indicates data after sharpening.

