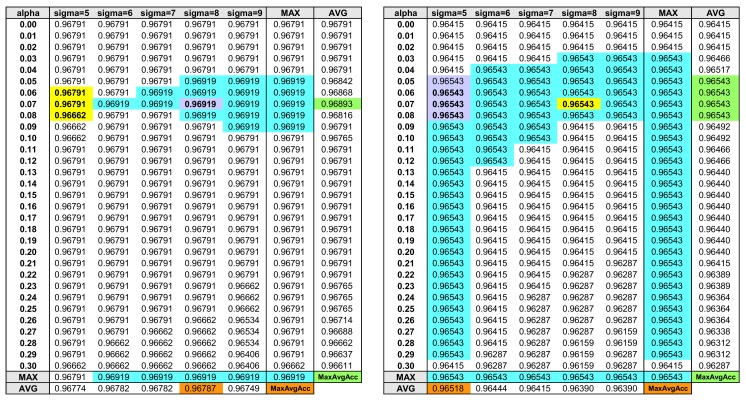
Figure 6.
Validation/test data HAR accuracy using different (, ) combinations. The cyan colored cells indicate the highest activity recognition accuracy. Maximum of average accuracy (MaxAvgAcc) is searched for various average accuracies of and values in order to find the suitable (, ) parameter values (orange and green colored cells). Assuming that the left table is the HAR accuracy of validation data, the purple cell where the two MaxAvgAccs meet identifies the suitable values ( = 8, = 0.07). Assuming that the right table is the HAR accuracy of test data, the yellow cell at ( = 8, = 0.07) achieves the highest accuracy of 96.543%.

