
Fig. 1.
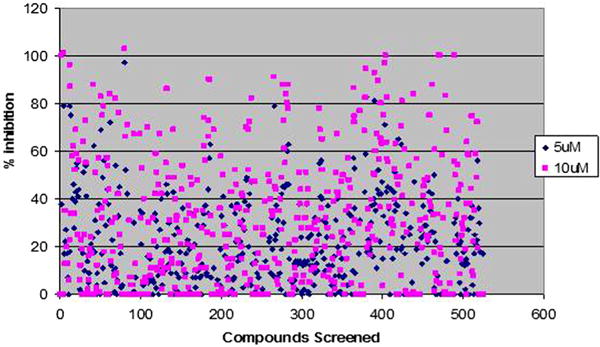
Scatter plot showing percentage control inhibition of 500 screened compounds. Compounds at two different concentrations 5 and 10 μM were screened for percentage inhibition relative to DMSO control (100% activity or 0% inhibition) minus background [(TBS/HbBSA) (for any auto refolding)]. The Z-factor (z = 0.81 ± 0.17) of the optimised assay reveals its high reliability, sensitivity and reproducibility.