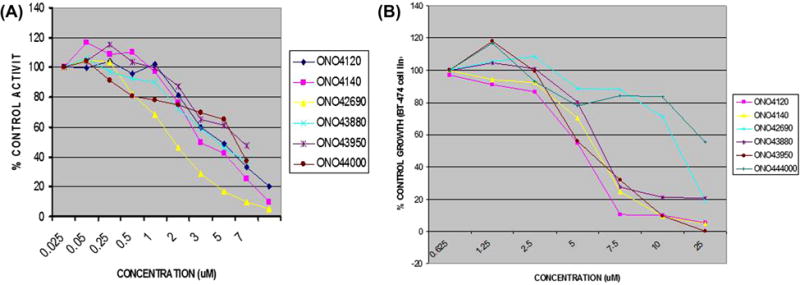
Fig. 2.

(A) IC50 curve of lead compounds (ONO4120, ONO4140, ONO42690, ONO43880, ONO43950 and ONO44000) as determined by IC50 luciferase refolding assays performed as described in Section 2.7. The assay measures the ability of the compounds to inhibit Hsp90 dependent refolding of denatured luciferase compared to the DMSO control (0% inhibition/100% luciferase refolding) The experiments were performed in triplicates (μM) and repeated at least twice. (B) Growth inhibition curve for GI50 determination of lead compounds viz: ONO4120, ONO4140, ONO42690, ONO43880, ONO43950 and ONO44000 in BT-474 cell lines as determined by Cell Titer-Blue Anti-proliferative Assay performed as described in Section 2.8. BT-474 cells were incubated with increasing concentrations of different compounds. Growth over 72 h was assessed by a method that determines intracellular ATP levels. GI50 value is taken as the concentration that decreases the growth by 50% relative to DMSO control compounds were assayed in triplicate. All compounds were used as DMSO stocks.
