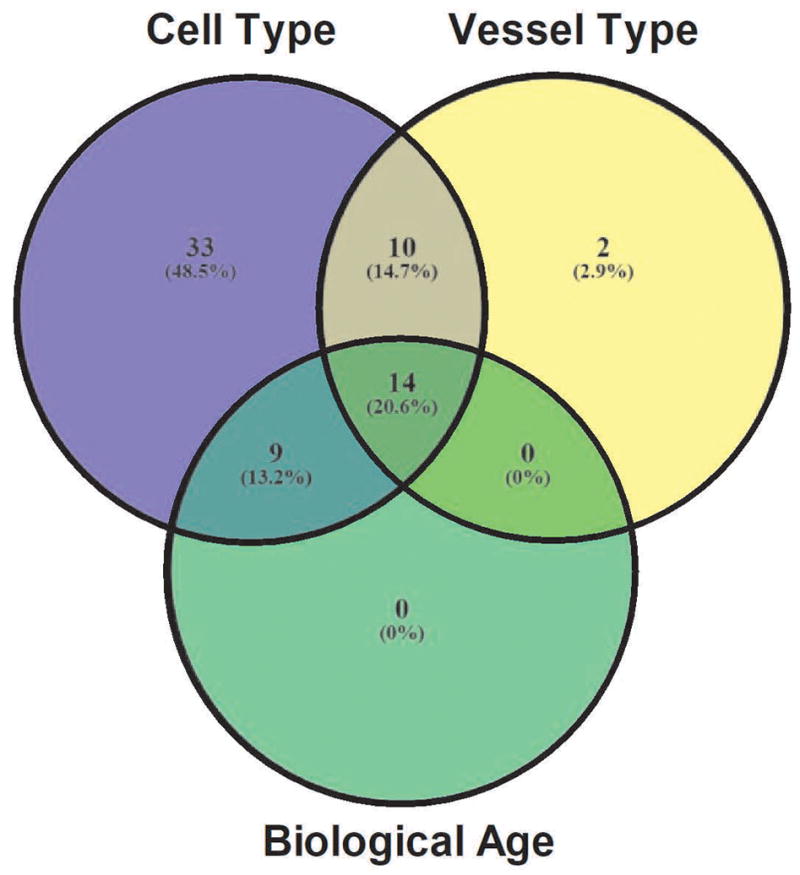
Figure 1. Differential gene expression based on cell type, vessel type and age.

Venn diagram depicts number of differentially expressed genes using 2−ΔΔCT (fold-change) values and P-values at a 0.05 threshold (Avg CT P < 0.05): SMC vs. EC (purple), MA vs. SEA (yellow) and Young vs. Old (green). Intersections represent differentially expressed genes that are shared between comparisons.
