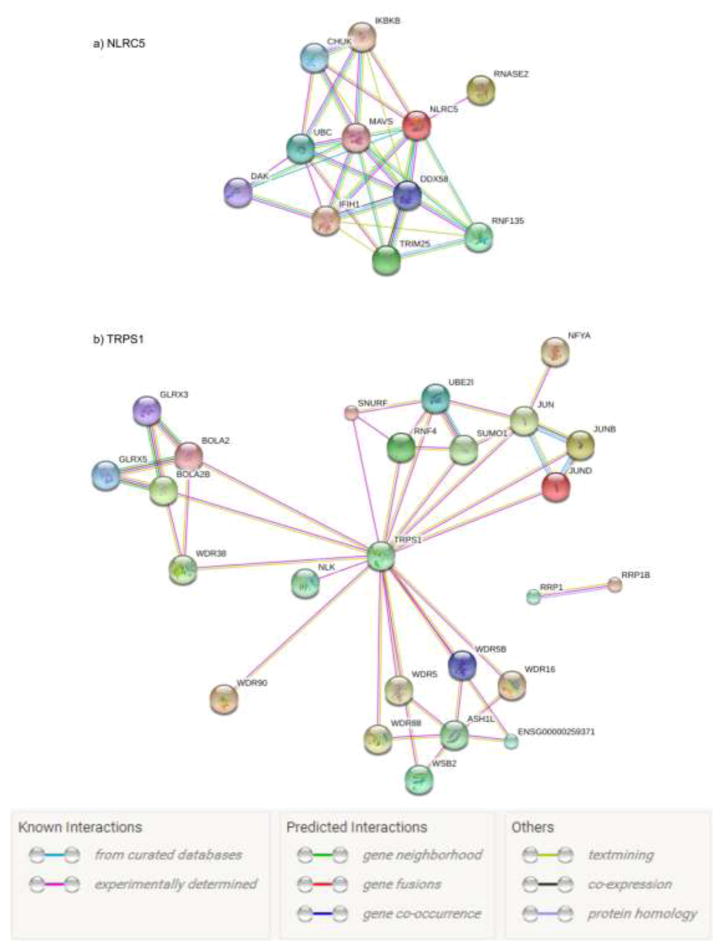
Fig. 3. Protein-protein interaction networks for significant genes NLRC5 and TRPS1.
a) Genes interacted with NLRC5. b) Genes interacted with TRPS1. Connections were based on evidence with “STRING Interaction Network Preview”. Network nodes represented proteins produced by the corresponding genes. Edges between nodes indicated protein-protein associations. Edge color indicated the type of interaction and was specified on the bottom of the figure.

