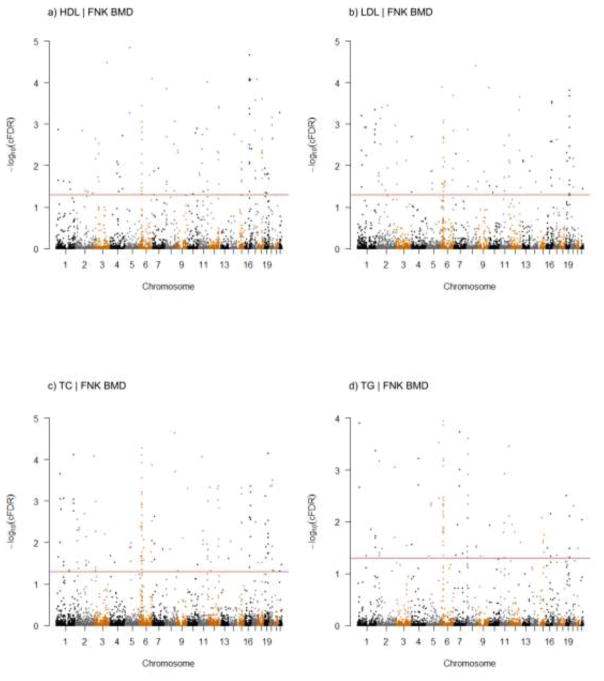
Fig. 4. Conditional Manhattan plot of −log10(cFDR) values for each type of PL conditioned on FNK BMD.
The black line marking the −log10(cFDR) value of 1.3 corresponded to a cFDR < 0.05. The figure marked the chromosomal locations of potentially novel SNPs. Details about all significant SNPs were offered in Supplemental Table 1.

