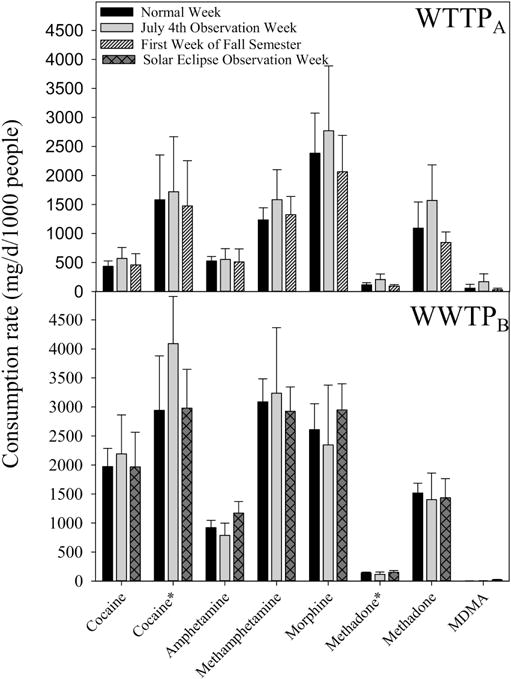
Fig. 1.

Per-capita consumption rate (mg/d/1000 people) of illicit drugs in two communities in Western Kentucky, USA. *represents the estimation based on the residual levels of their parent drugs in wastewater influent. Error bars indicate standard deviation, n=3.
