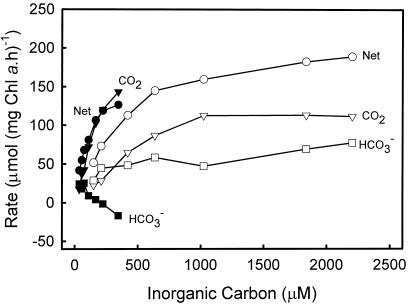
Figure 2.
Comparison of net photosynthetic rates (●, ○), CO2 uptake (▾, ▿), and HCO3− uptake (▪, □) for Symbiodinium sp. at pH 7.0 (black symbols) and pH 8.0 (white symbols) after being in culture for 1 d. Assays were conducted in 25 mm BTP and 428 mm NaCl with 50 μm AZA at 28°C with a photon flux density of 500 μE m−2 s−1. Data was collected using the mass spectrometry disequilibrium technique described in “Materials and Methods.”

