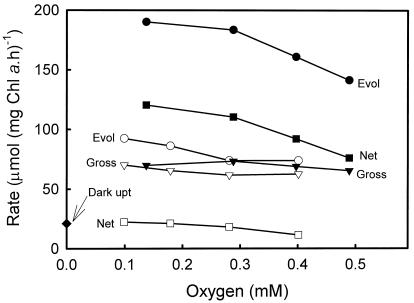
Figure 6.
Photosynthetic O2 exchange in freshly isolated Symbiodinium sp. in response to external O2. The experiments were conducted as described in Figure 6 at a cell density of 4.7 μg Chl a mL−1. Values for gross O2 evolution (Evol), gross O2 uptake, and net O2 evolution are shown for each treatment, together with a value for O2 uptake measured in the dark. O2 responses are shown both in the presence of 1 mm added Ci (black symbols) and in the absence of added Ci (white symbols). Experiments were conducted from low to high O2, and the O2 concentration was increased between points by the introduction of a small bubble of 18O2.

