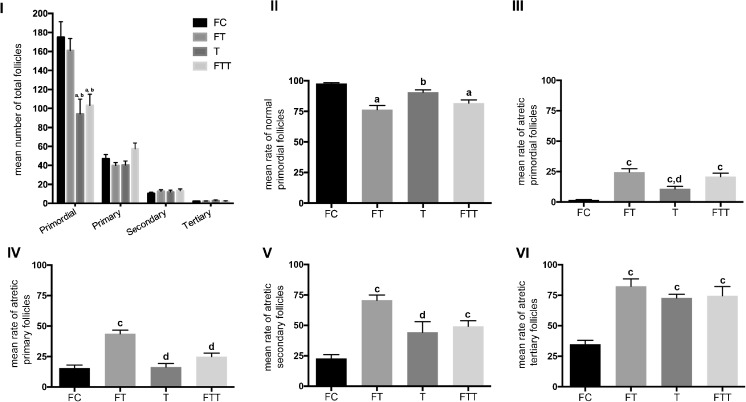
Fig. 1.
Mean number of total follicles (I), mean rate of normal primordial follicles (PFs) (II), mean rate of atretic PFs (III), mean rate of atretic primary follicles (IV), mean rate of atretic secondary follicles (V), mean rate of atretic tertiary follicles (VI) in fresh control group (FC), frozen and thawed group (FT), fresh-transplanted group (T), and frozen and thawed before transplanted group (FTT). a Statistically significant from FC group (p < 0.001). b Statistically significant from FT group (p < 0.001). c Statistically significant from FC group (p < 0.05). d Statistically significant from FT group (p < 0.05)

