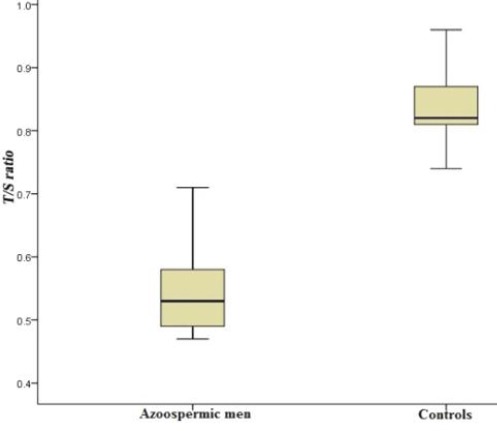
Fig. 2.

The distribution curve of T/S (relative telomere length) in patients (males affected by azoospermia) and controls (fertile males). The vertical lines show the minimum and maximum values. The relative leukocyte telomere length to HBG (T/S) ratio of males affected by azoospermia was significantly lower (p < 0.05, 95% CI) than fertile males (0.54 vs. 0.84). The lowest value of this ratio was 0.47 and 0.74, and the highest level identified to be 0.71 and 0.96 in azoospermic males and fertile males, respectively.
