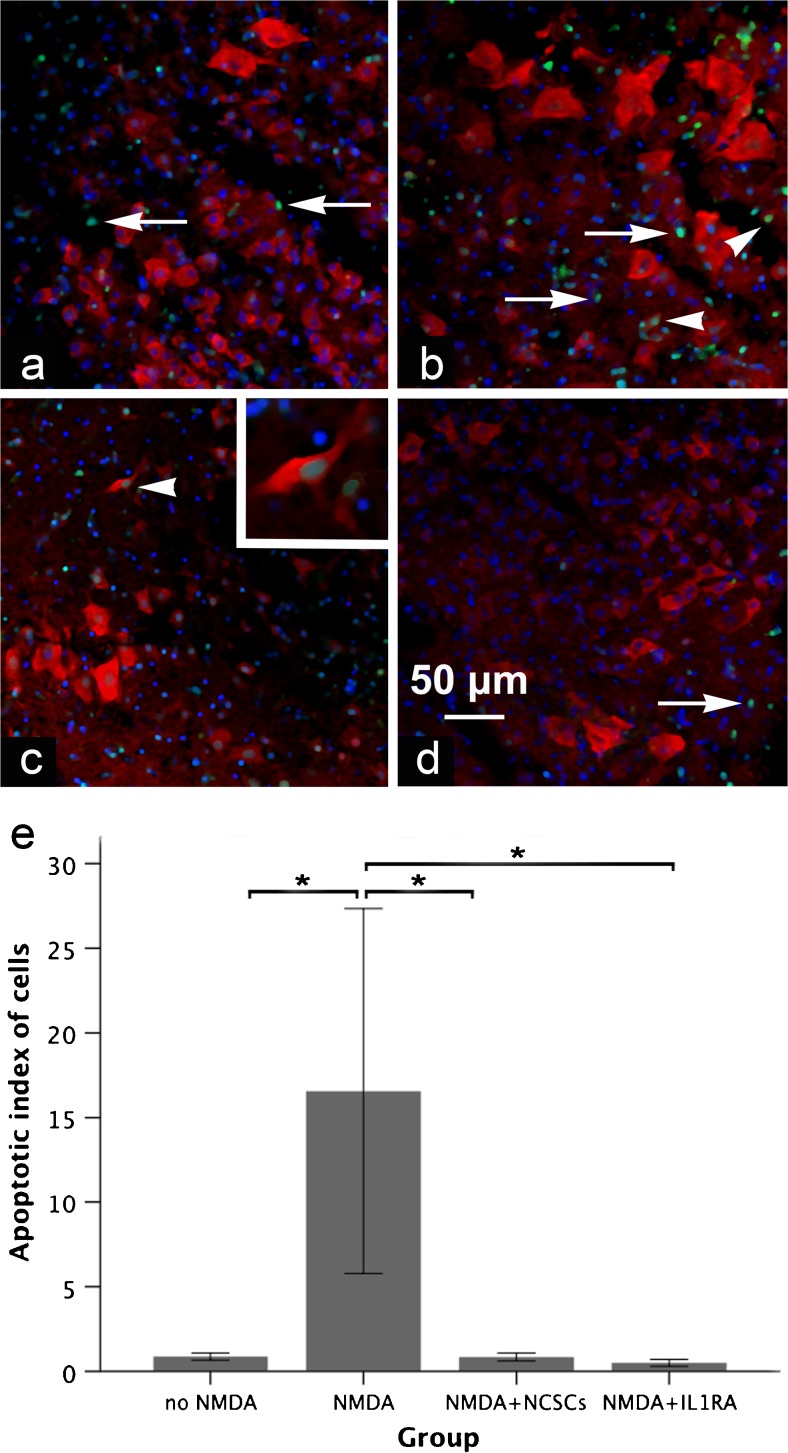
Fig. 2.
a–e Micrographs of sections through the gray matter of SCSCs (a no-NMDA, b NMDA, c NMDA + NCSC, d NMDA + IL1RA) 6 days post-NCSC application stained for NeuN (red), TUNEL (green) and DAPI (blue). The inner parts of the sections were devoid of e-GFP-positive NCSCs since the latter remained on the surface of the slice cultures. The above sections were obtained from the inner parts of the cultures, an area that NCSCs did not reach. Apoptotic cells were identified by co-localization of TUNEL and DAPI (arrows) and apoptotic neurons were identified as co-localization of TUNEL, DAPI and NeuN (arrowheads, shown also in higher magnification in the right top corner in c). The proportion of apoptotic cells in relation to the number of neurons was significantly higher in the NMDA group (b) compared to the other groups. Graph (e) shows the apoptotic index of cells in different groups (statistical analysis was performed by non-parametric Kruskal–Wallis followed by Mann–Whitney U tests; solid bars indicate means and error bars denote SEM, p ≤ 0.05)

