
FIGURE 2.
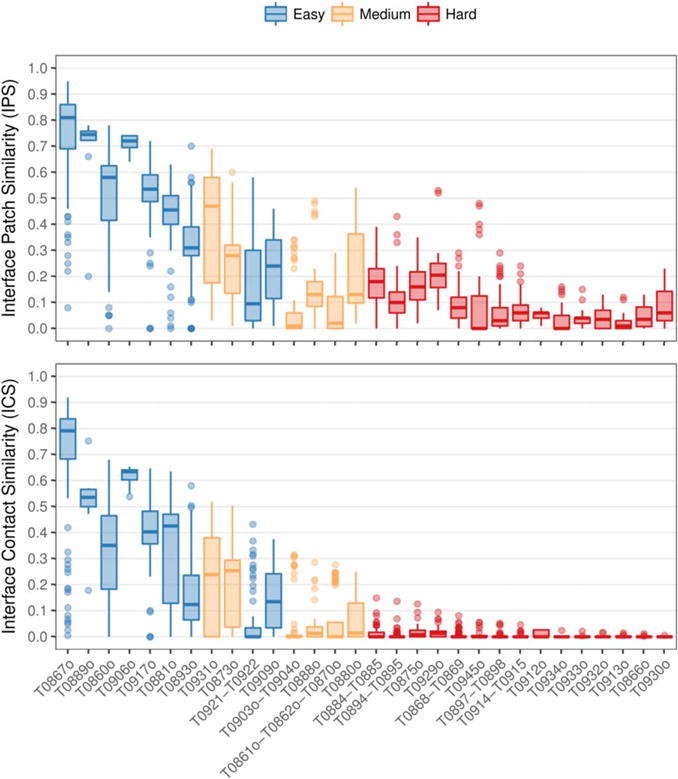
Distribution of IPS (top) and ICS (bottom) scores of all submitted models for each target assembly as a boxplot. The higher the IPS and ICS scores, the more accurate the model. Targets colored by prediction difficulty and sorted decreasingly by maximum ICS score