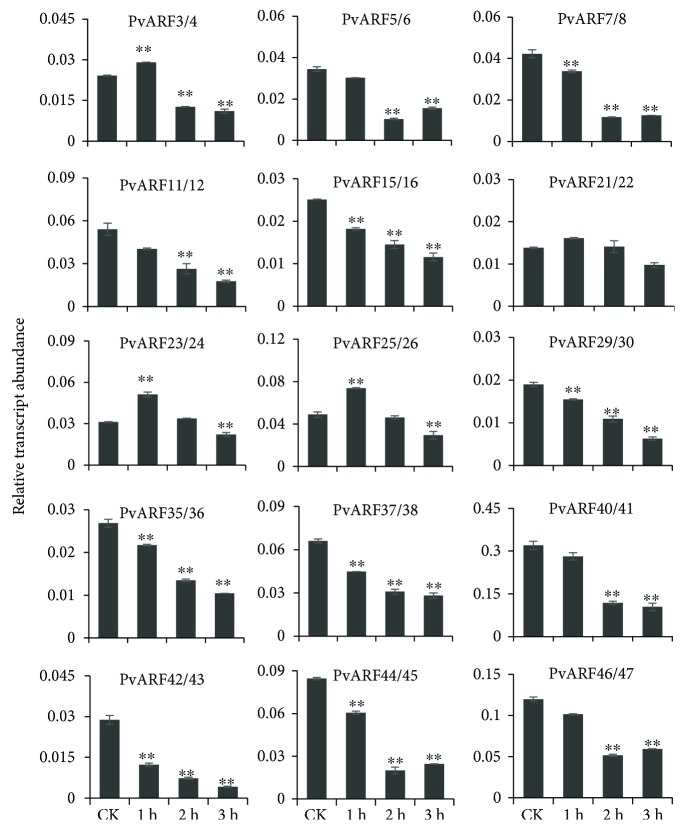
Figure 7.
The expression of PvARF genes in response to treatment with 5 μM NAA solution for 1, 2, and 3 hours. Control plants were grown in hormone-free medium. Error bars represented variability of qRT-PCR results from three replicates. Data are means ± SE of three separate measurements. Statistically significant differences were assessed using Student's t-tests (∗∗ P < 0.01).

