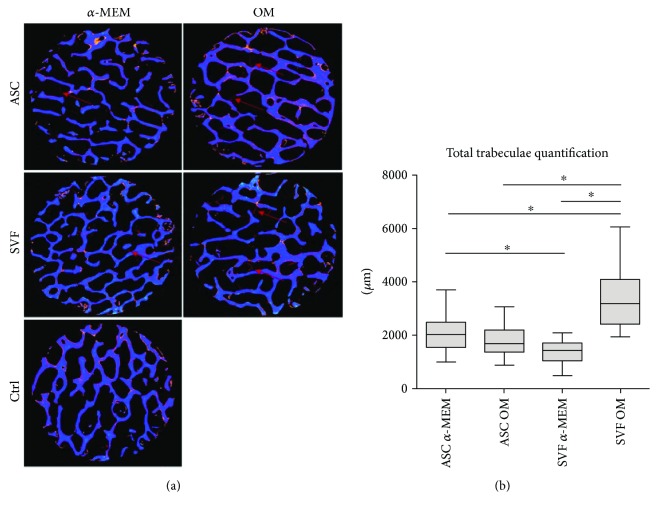
Figure 4.
Analysis of new bone formation by micro-CT. (a) Representative images of X-ray tomography of SB with and without osteogenic medium (OM), after 60 days of culture with ASCs or SVF. The SB is shown in blue, whereas the newly formed mineralized tissue is in red (as indicated by the arrows). (b) Quantification of the newly formed mineralized tissue measured on SB cultured with ASCs or SVF, with or without OM. ∗ p < 0.05.

