Figure 3.
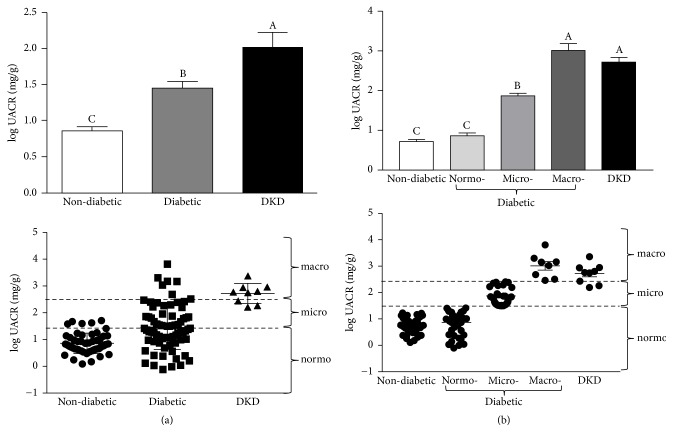
Urinary albumin to creatinine ratios (UACRs). (a) Log-transformed UACRs among nondiabetic controls, diabetic patients with no known kidney disease, and diabetic patients with diagnosed diabetic kidney disease (DKD). Data are represented as both a bar chart showing mean log UACR ± SEM within each group (top) and a scatter plot showing values for each individual within the group (bottom). UACR levels corresponding to normo- (logUACR < 1.47), micro- (1.47 < logUACR < 2.47), and macroalbuminuria (logUACR > 2.47) are indicated by dashed lines. (b) Log-transformed UACR as in (a), except that diabetic patients with no known kidney disease have been subdivided into normo-, micro-, and macroalbuminuria based on their UACRs. Labels without a common letter are significantly different from one another (p < 0.05) based on one-way ANOVA and Tukey's honest significant difference test.

