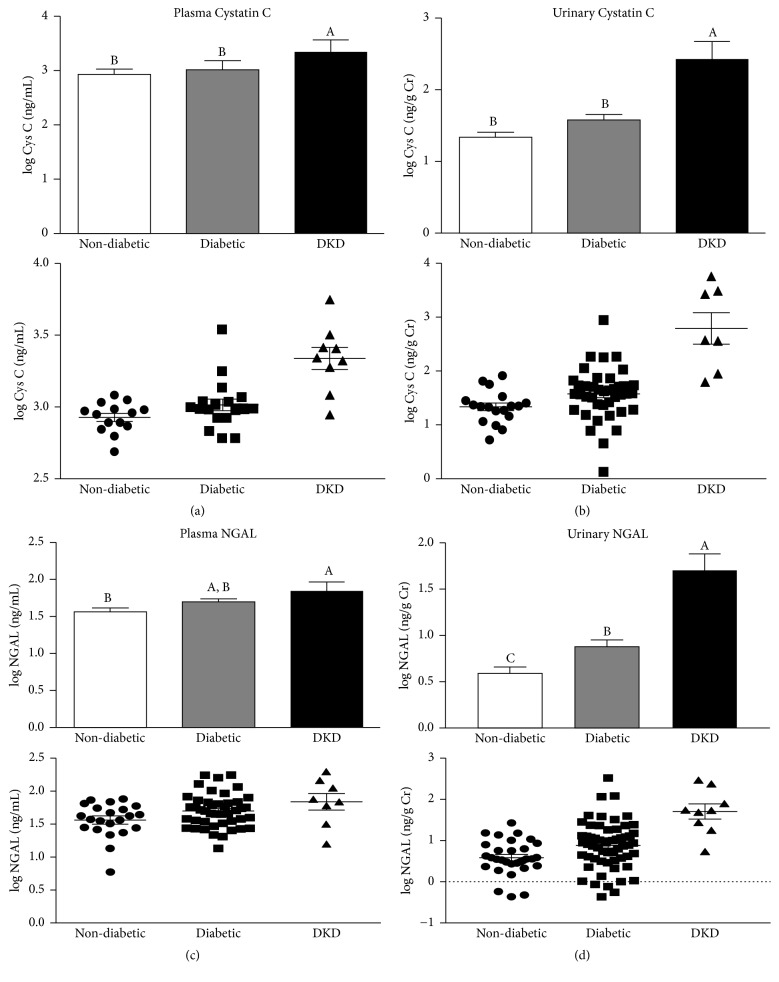
Figure 5.
Cystatin C and neutrophil gelatinase-associated lipocalin (NGAL) levels based on clinical diagnosis status. (a)-(b) Log-transformed plasma (a) or urinary (b) cystatin C levels among nondiabetic subjects, diabetic patients with no known kidney disease (diabetic), and patients with diagnosed diabetic kidney disease (DKD). Urinary cystatin C levels were normalized to urinary creatinine to account for differences in urine concentration. Data are represented as both a bar chart showing mean log Cystatin C ± SEM within each group (top) and a scatter plot showing values for each individual within the group (bottom). (c)-(d) Log-transformed plasma (c) and (d) urinary NGAL levels among nondiabetic subjects, diabetic patients with no known kidney disease (diabetic), and patients with diagnosed diabetic kidney disease (DKD). Urinary NGAL levels were normalized to urinary creatinine to account for differences in urine concentration. Data are represented as both a bar chart showing mean log NGAL ± SEM within each group (top) and a scatter plot showing values for each individual within the group (bottom). Labeled means without a common letter are significantly different from one another (p < 0.05) based on one-way ANOVA and Tukey's honest significant difference test.

