
Fig. 3. Impact in scientific careers.
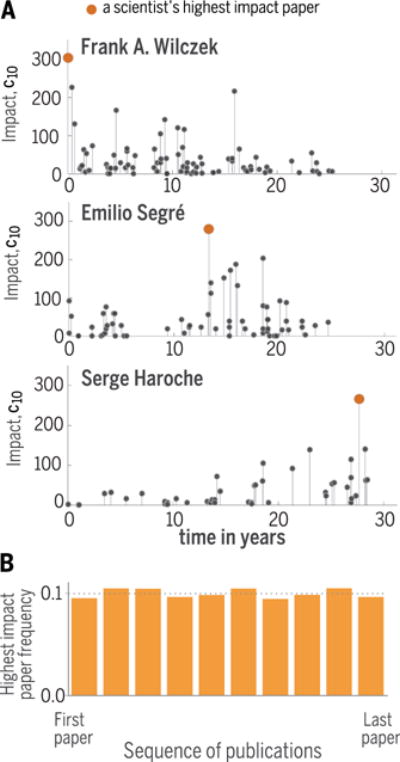
(A) Publication record of three Nobel laureates in physics. The horizontal axis indicates the number of years after a laureate’s first publication, each circle corresponds to a research paper, and the height of the circle represents the paper’s impact, quantified by c10, the number of citations after 10 years. The highest-impact paper of a laureate is denoted with an orange circle. (B) Histogram of the occurrence of the highest-impact paper in a scientist’s sequence of publications, calculated for 10,000 scientists. The flatness of the histogram indicates that the highest-impact work can be, with the same probability, anywhere in the sequence of papers published by a scientist (49).