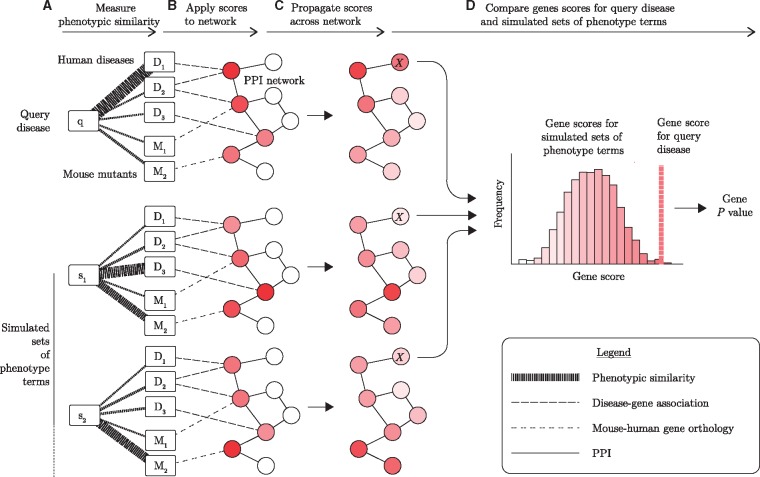
Fig. 1.
PhenoRank overview. (A) Phenotypic similarity of the query disease (q) to each disease in OMIM (D) and each mouse mutant in MGD (M) is quantified. Thicker lines represent stronger phenotypic similarities. (B) Phenotypic similarity scores are applied to genes in a PPI network, using known disease–gene associations and mouse-human gene orthology data. Darker nodes represent genes with greater relevance to the disease of interest. (C) Phenotypic relevance scores are propagated across a PPI network, so that genes that interact with many high scoring genes are also scored highly. (D) Gene scores generated for the query disease are compared against gene scores generated using simulated sets of phenotype terms (S). By comparing the score the gene receives for the query disease against the distribution of scores the gene receives for the simulated sets of phenotype terms, a P value for each gene is generated. In this illustrative example, the computation of a P value for the gene marked X is shown. While only two simulated sets of disease phenotypes are shown, PhenoRank is run with 1000 simulated sets by default

