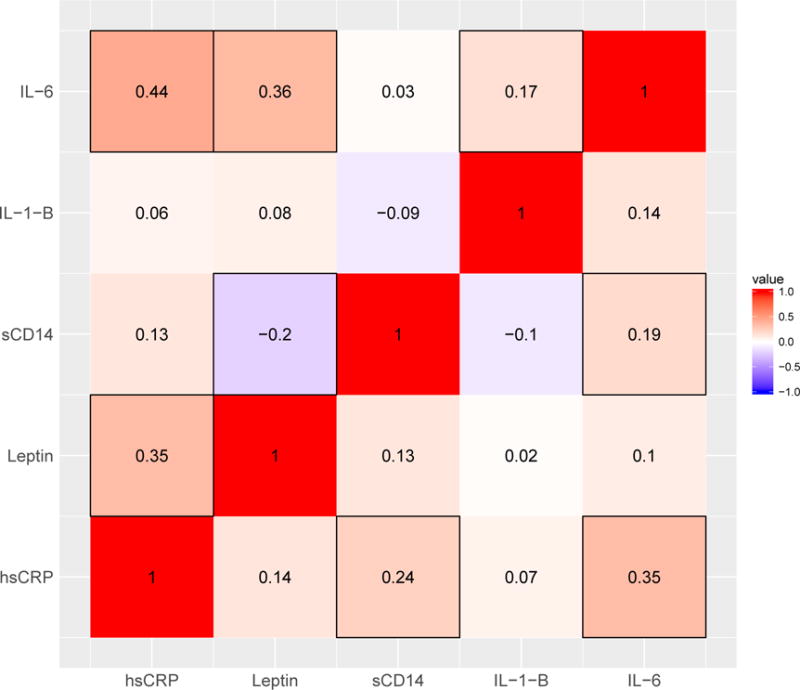
Figure 2.

Heat map showing the pairwise Spearman’s rank correlations between 5 biomarkers. The upper-left correlations are unadjusted, the lower-right correlations are partial correlations adjusted for age, sex, race, BMI, CD4 cell count, smoking status, and study cohort. Shading denotes the strength of the correlation with those closer to −1 and 1 being darker. Boxes are placed around correlations whose 95% confidence intervals do not contain zero. This figure appears in color in the electronic version of this article.
