
Figure 5.
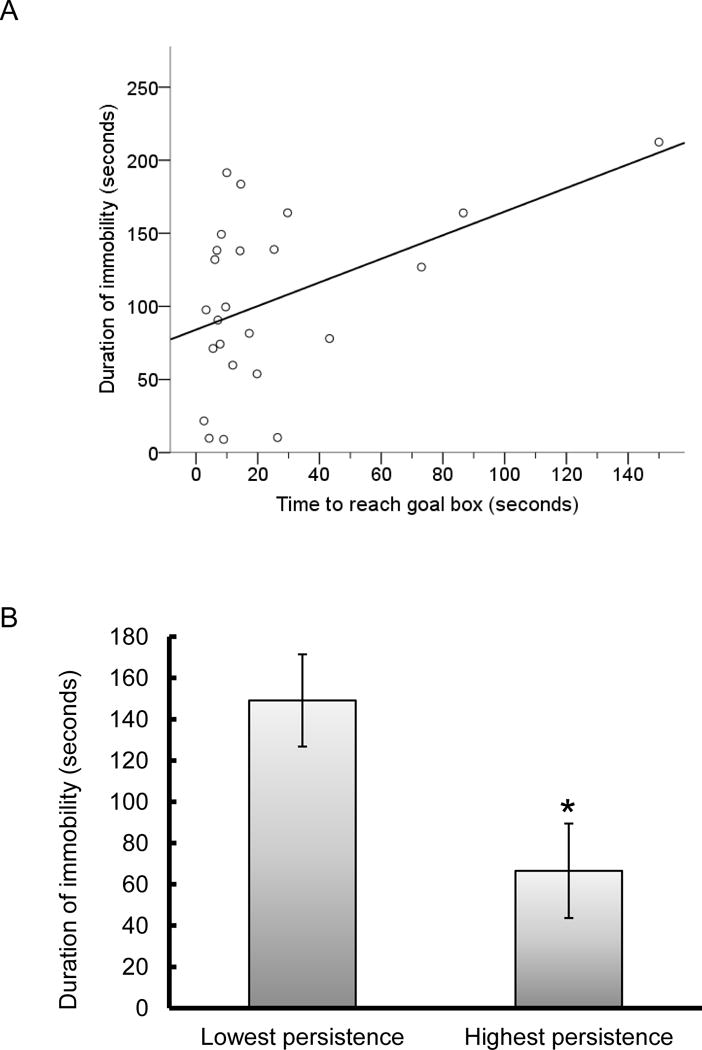
A. Individual values for all mice of time to reach the goal box (seconds) in the Long Alley over the duration of immobility (seconds) during the Forced Swim. The linear regression was significant. B. Mean duration of immobility (seconds) during the Forced Swim for the five least persistent mice (during extinction in the Straight Alley) and the five most persistent mice. * = p < .05. Brackets indicate standard error of the mean.