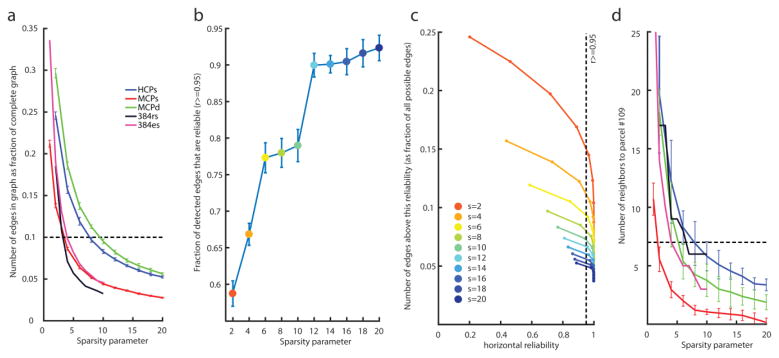
Figure 6.
Causal graph sparsity and reliability. These panels justify how we chose the particular sparsity settings for all subsequent causal discovery analyses. a: Number of edges produced (as proportion of the complete graph) as a function of different sparsity parameters across our five datasets. As an example, the densest graph in the HCPs dataset is obtained with the lowest sparsity value we tested (a sparsity of 2) and produces graphs that are about 25% complete. For our analyses in this paper, we chose a criterion of producing about 10% of the complete graph (dashed line) across all datasets as a reasonable value that permitted comparisons in all subsequent analyses. b: Fraction of edges in the HCPs graph with horizontal reliability ≥0.95 (see Methods for a description of our horizontal reliability measure). As sparsity increases (blue dots towards the right) so does the fraction of reliable edges. c: The number of edges in the HCPs graph (as a proportion of the maximal number of edges that would be present in the complete graph) seen above a given horizontal reliability. Sparsity is encoded as line color. The leftmost point of each curve corresponds to observing a given edge only in 1 of the 11 datasets. Observing an edge in a sparse graph (large sparsity parameter s) is more surprising than observing an edge in a dense graph (small s), which our statistic for horizontal reliability captures (see Methods, and Supplementary Figure S3): hence the leftmost point of each curve shifts to the right for a higher sparsity parameter s. The second leftmost point corresponds to observing one repeat, i.e. to an edge repeating across 2 out of 11 datasets. Very high sparsity parameters (a sparsity of 20, blue curve) produce very reliable graphs. d: Same as a, except showing number of edges to the right amygdala (parcel #109), which is the node that we electrically stimulated in the neurosurgical patient. The dashed line corresponds to the number of edges to #109 obtained on average in the HCPs datasets with s=8 (as in a). Equating the number of edges to #109 is another way to set the sparsity parameters across datasets, which we also explored (see Figure 8).

