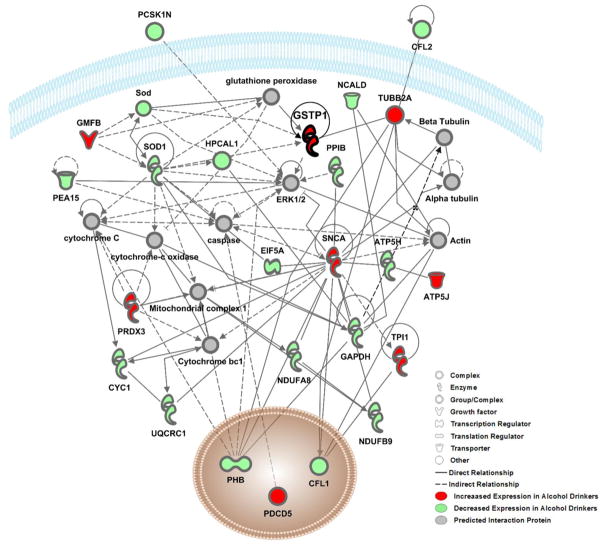
Figure 3. Interaction Network 1 showing relationships between proteins in the highest scored network (P-score=62) identified by Ingenuity Pathway Analysis.
The color of nodes indicates increased-(red) or decreased-(green) expression of a protein in alcohol drinking mice as relative to water drinking controls. Proteins in grey nodes were not identified as being differentially expressed in our study but represent interacting proteins that were identified in the computationally generated networks. Black lines represent direct relationships between proteins and dashed lines represent indirect relationships. The interacting proteins and relationships were all identified based on the wealth of evidence stored in the IPA knowledge memory indicating relevance for this network.

