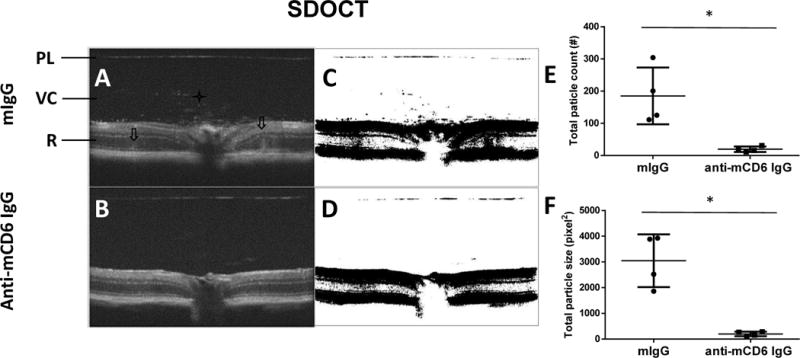
Figure 5.

Representative spectral-domain optical coherence tomography (SD-OCT) images and analysis in control and CD6 mAb-treated mice on Day 8 after transfer. A and B: SD-OCT images revealed more reflective foci (star) and retinal folds (arrows) in mouse IgG-treated mice, compared to CD6 mAb-treated mice. PL: posterior lens margin, VC: vitreous cavity, R: retina. C and D: Particles in the vitreous were assessed in SD-OCT images processed using ImageJ. E and F: Fewer total particles and reduced particle sizes were observed in the vitreous cavities of CD6 mAb-treated mice vs. control mice. Each dot represents one mouse. Data are shown as means ± standard deviations. N=4. * p <0.05, Mann-Whitney test.
