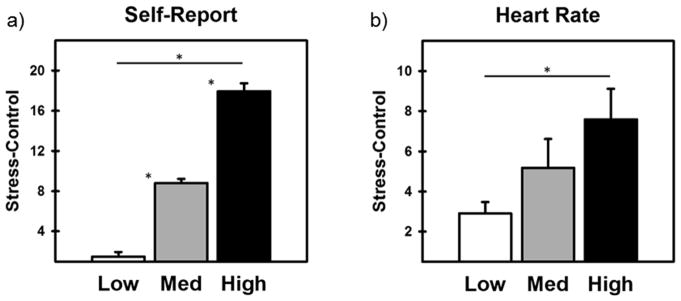
Figure 1.
Differential (Stress - Control) self-reported stress and heart rate (HR) during the MIST for Low, Medium, and High stress-reactivity groups. a) Increases in self-reported stress from Low to Medium to High demonstrated increased stress reactivity across groups. b) HR was measured as a manipulation check and demonstrated that the differential HR (Stress - Control) increased across Low to High stress-reactivity groups. Asterisk indicates a significant difference (p < 0.05; corrected).

