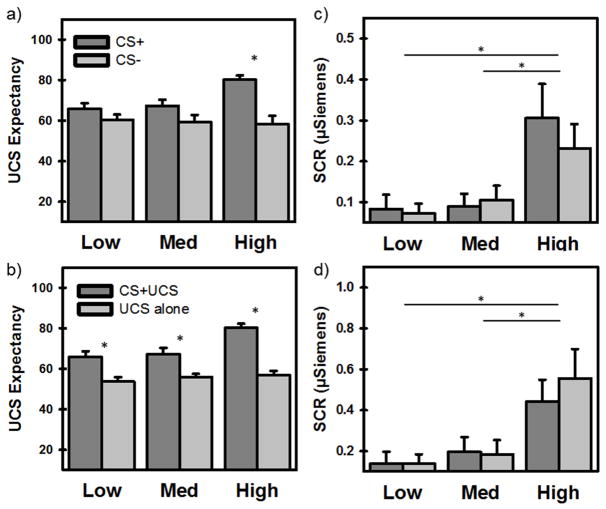
Figure 2.
Differential responses to stimulus events (CS+ vs CS− or CS+UCS vs UCS alone) separated by stress-reactivity groups (Low, Medium, High) for each behavioral and psychophysiological measure (UCS expectancy, SCR). a) The High group (but not Low and Medium) reported greater UCS expectancy to the CS+ than CS−. b) All groups reported greater UCS expectancy prior to UCSs that were predictable (CS+UCS) compared to UCSs that were unpredictable (UCS alone). c) Average SCRs to the CSs (CS+ and CS−) were greater for the High than Medium and Low stress-reactivity groups. Medium and Low groups did not differ. d) Average SCRs to the UCSs (CS+UCS and UCS alone) were greater for the High than Medium and Low groups. Medium and Low groups did not differ. Asterisk indicates a significant difference (p < 0.05; corrected).

