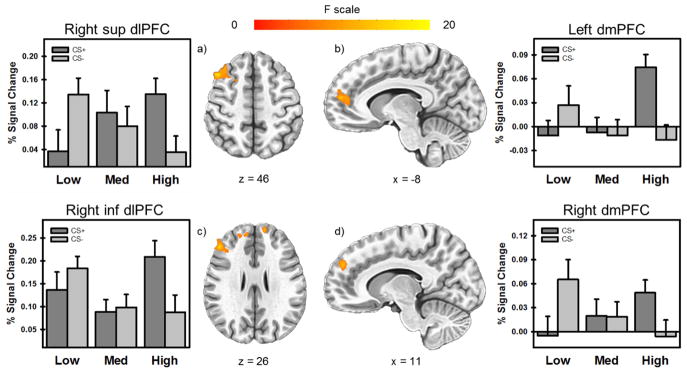
Figure 4.
Clusters of significant activation for the interaction between stimulus type (CS+ vs CS) and stress-reactivity groups (High, Medium, Low). Differential neural responses to CS+ and CS− varied across stress-reactivity groups in the dlPFC and dmPFC (a–d). As stress reactivity increased, responses to CS+ showed a corresponding increase. Alternatively, as stress reactivity increased, responses to CS− demonstrated a corresponding decrease.

