Figure 7.

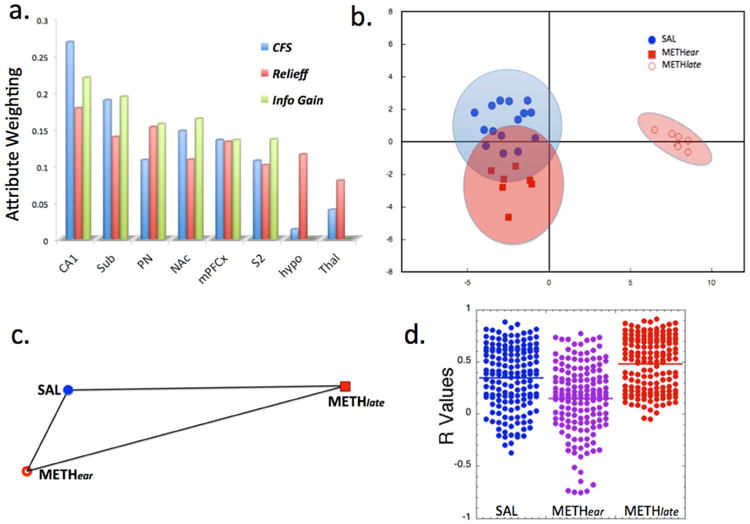
Large separations between the METHlate group and the SAL and METHear groups, and relations between variables. a) Attribute selection for fCBV changes among 26 different brain regions using either Correlation feature selection (CFS), Relief-f or information gain algorithms showing the top 8 brain regions contributing to separation between the groups. b) Linear discriminant analysis based upon the fCBV data shows large separation between the METHlate group and the SAL and METHear groups. Wilk's lambda shows significant separation along the primary axis and not along the secondary (y) axis. The ellipses represent 95% confidence bounds for the groups. c) Relative Euclidean distances between the SAL, METHear and METHlate groups from the fCBV data. The METHlate group is farthest from the other two groups. d) Distribution of R values determined from diFC from the brain regions shown in a) to the other brain regions for the three groups. It is clear that there is a decrease of overall connectivity in the METHear group compared to the SAL (p < 10-4) and that METHlate is significantly greater than SAL (p < 10-3) or METHear (p<10-4) (the p values listed are the maximum from using a t-test, Mann-Whitney U or Komolgorov-Smirnov test).
