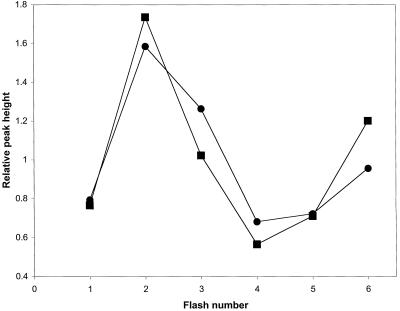
Figure 5.
Oscillation pattern of thermoluminescence B-band from wild-type (●) and ΔpsbY (▪) cells. One-hundred-microliter samples containing 20 μg of chlorophyll were dark-adapted for 3 min at 30°C prior to cooling. During the cooling of the samples to −25°C, groups of one to six saturating single-turnover flashes were applied at 0°C. Thermoluminescence emission was measured while warming the samples at a constant rate of 0.7°C/s. The B-band emission peaks for both wild-type and ΔpsbY cells were at 30°C. x axis, Number of excitation flashes; y axis, relative B-band peak intensity calculated as YX/Σ(1–6)Y.

