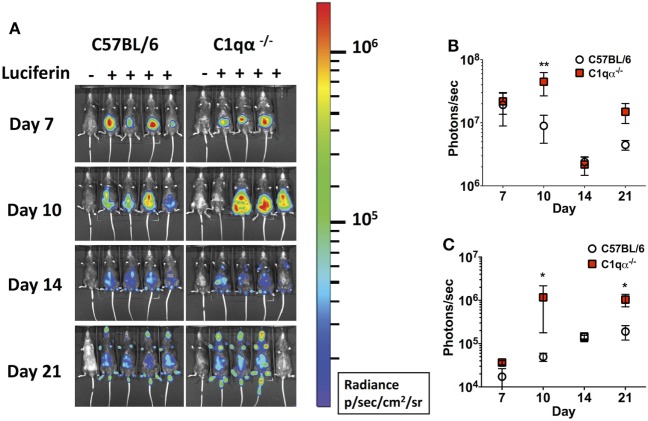
Figure 2.
Temporal and spatial tracking of Borrelia burgdorferi strains following infection in C1qα−/− mice. (A) C57BL/6 and C1qα−/− mice were infected with B. burgdorferi containing firefly luciferase at a dose of 104. Mice were treated with d-luciferin at 7, 10, 14, and 21 days post-infection and imaged. For each image shown, the mouse on the far left was infected with B. burgdorferi but did not receive d-luciferin serves as a background control. The image shown was obtained from a 10 min exposure. All images from each time point were normalized to the same photon/second (p/s) range of 1.15 × 10⁴ to 1.86 × 10⁶ and displayed on the same color spectrum scale (right). (B) Quantification of in vivo luminescence from each mouse. Total detected light was measured for each individual mouse in its entirety, and the total flux value was determined (in photons/second). The total flux values from mice treated with d-luciferin were normalized by subtracting the background total flux value of the infected mouse with no added luciferin relative to mice that were given luciferin. Total flux was determined after infection at days 7, 10, 14, and 21 for mice infected with 104 B. burgdorferi. (C) Quantification of in vivo luminescence from the joint region. The joint localized signal was selectively measured, and the total flux value was determined (in photons/second). Each data point represents the average signal from the left and right ankles of each mouse. White circles and red squares represent signal from C57BL/6 and C1qα−/− mice, respectively, both infected with ML23/pBBE22luc (n = 3 or 4; *P < 0.05 and **P < 0.01).

