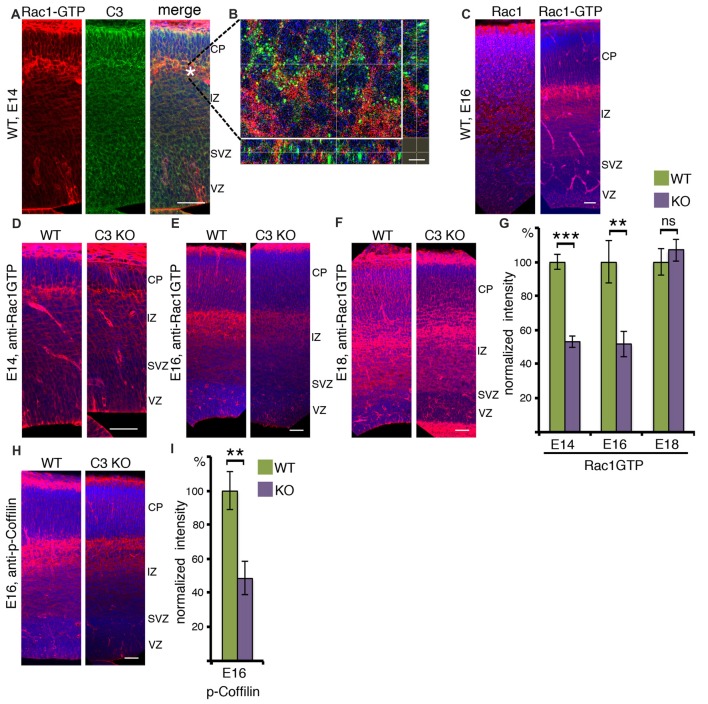
Figure 2.
Activated RAC1 in the developing cortex. (A) E14 brain sections were immunostained with anti-RAC1-GTP and anti-C3 antibodies. RAC1-GTP shows the highest intensity on the entrance to the cortical plate (CP). The scale bar is 50 μm. (B) High-magnification shows that in this area the signal of C3 is in close vicinity to that of RAC1-GTP. The scale bar is 5 μm. (C) E16 brain sections were immunostained with anti-RAC1 or anti-RAC1-GTP antibodies. Total RAC1 was evenly distributed all over the cortex, whereas the intensity of RAC1-GTP immunostaining signal was the highest between intermediate zone (IZ) and CP. The scale bar is 50 μm. (D–F) Comparison of anti-RAC1-GTP immunostaining in WT and C3 KO on different embryonic days: E14 (D, N = 6), E16 (E, N = 6), E18 (F, N = 6). (G) The normalized intensity of RAC1-GTP is presented as percentage of WT levels. (H) WT and C3 KO E16 brain sections (N = 6) were immunostained with anti-phospho-COFILIN antibodies. The scale bars are 50 μm. (I) The normalized intensity of phospho-COFILIN is presented as percentage of WT levels. Student’s t-test, ***p < 0.001, **p < 0.01.

