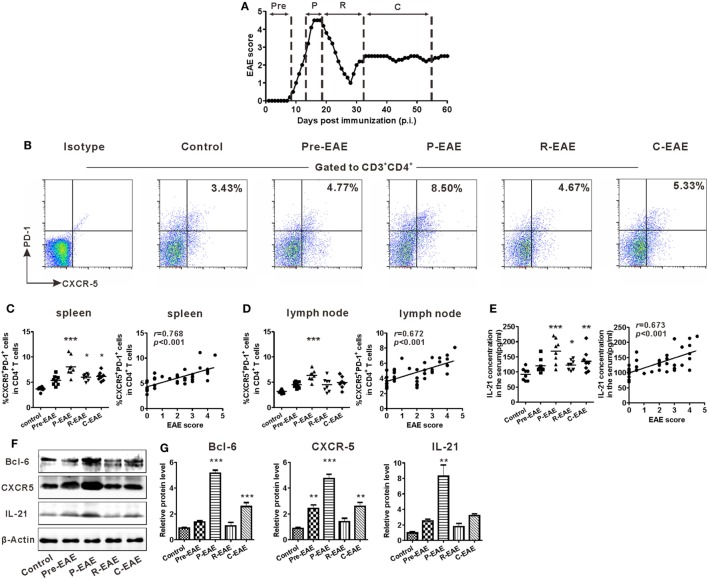
Figure 2.
Kinetics of T follicular helper (Tfh)-like cell in the secondary lymphoid organs (SLOs) during the different phases of experimental autoimmune encephalomyelitis (EAE). (A) The clinical course of MOG35–55-induced EAE in C57BL/6J mice. Mean clinical score is shown (n = 8). (B) Representative flow cytometry results of CD3+CD4+CXCR5+PD-1+ Tfh-like cells in the spleens of EAE mice during different clinical phases. Gates were set on CD3+CD4+ cells. Numbers in the upright corner illustrated the percentage of CXCR5+PD-1+ cells in CD4+ T cells. Comparisons of the frequency of Tfh cells in spleens [(C) left] and draining lymph nodes [(D) left] at different phases of EAE mice (n = 8/time point). The correlation analysis between the EAE score and the frequency of Tfh-like cells in spleens [(C) right] or draining lymph nodes [(D) right]. (E) The serum level of IL-21 at different phases of EAE mice (left, n = 8/time point) and its correlation with EAE score (right). (F) Representative blots band of Bcl-6, CXCR5, and IL-21 in splenocytes of EAE mice at different phases. (G) Statistical data of the relative protein level of Bcl-6, CXCR5, and IL-21 in splenocytes of EAE mice at different phases. Values are mean ± SEM. For (C–E), each data point represents an individual subject and the horizontal lines represent the means (n = 8). Results are representative of three independent experiments. Abbreviations: Pre, pre-clinical; P, peak; R, remission; C, chronic. *P < 0.05, **P < 0.01, ***P < 0.001 vs. control.

