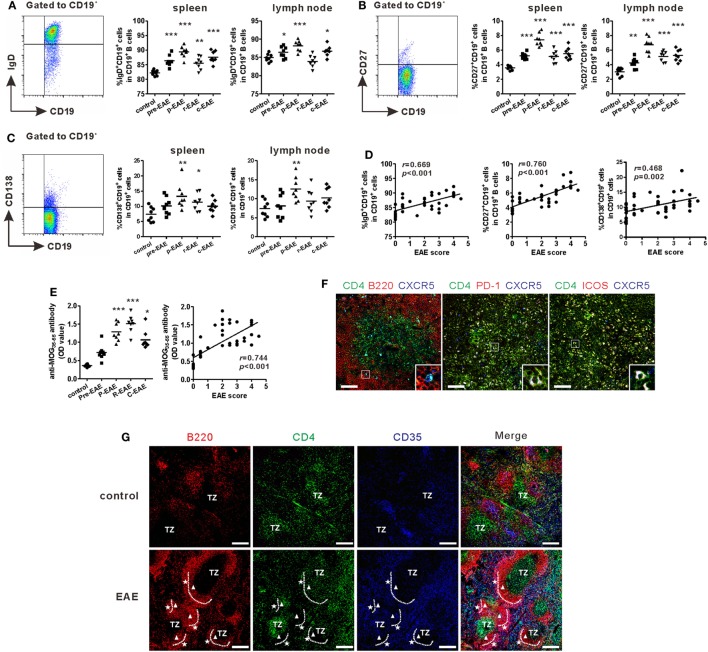
Figure 3.
B cell profile and morphology of germinal centers (GCs) in experimental autoimmune encephalomyelitis (EAE) mice. Comparisons of the frequencies of CD19+IgD+ mature B cells (A), CD19+CD27+ memory B cells (B), and CD19+CD138+ plasma cells (C) in the spleen and draining lymph nodes at different phases of EAE mice. (D) The correlation analysis between each of the three subsets in the spleen mentioned above and EAE score, respectively. (E) The serum level of anti-MOG35–55 antibodies (represented as OD value) at different phases of EAE mice and its correlation with EAE score. For (A–E), each data point represents an individual subject and the horizontal lines represent the means (n = 8/time point). Results are representative of three independent experiments. Abbreviations: Pre, pre-clinical; P, peak; R, remission; C, chronic. *P < 0.05, **P < 0.01, ***P < 0.001 vs. control. (F) Immunofluorescence staining of the spleen of EAE mice showed T follicular helper-like cells located at the T-B border (bar = 50 μm). (G) Immunofluorescence staining compared the GC structures between the spleen of control and EAE mice (TZ = T-cell zone, white triangle: dark zone, white pentacle: light zone, bar = 200 μm). Sections are representative of three mice analyzed.

