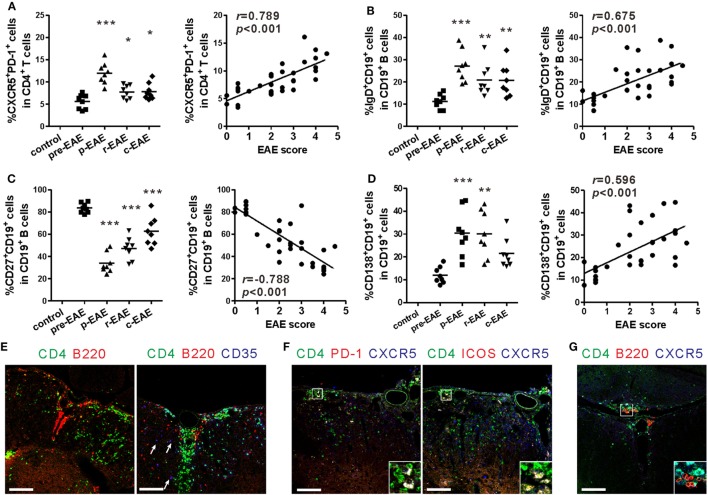
Figure 4.
T follicular helper (Tfh)-like and B cells entering into the central nervous system (CNS). (A) Comparison of the frequency of Tfh-like cells in the CNS (spinal cord and brain) of experimental autoimmune encephalomyelitis (EAE) mice at different phases (left) and its correlation with EAE score (right). (B) Comparison of the frequency of mature B cells in the CNS (spinal cord and brain) of EAE mice at different phases (left) and its correlation with EAE score (right). (C) Comparison of the frequency of memory B cells in the CNS (spinal cord and brain) of EAE mice at different phases (left) and its correlation with EAE score (right). (D) Comparison of the frequency of plasma cells in the CNS (spinal cord and brain) of EAE mice at different phases (left) and its correlation with EAE score (right). For (A–D), each data point represents an individual subject and the horizontal lines represent the means (n = 8/time point). Results are representative of three independent experiments. Abbreviations: Pre, pre-clinical; P, peak; R, remission; C, chronic. *P < 0.05, **P < 0.01, ***P < 0.001 vs. Pre. (E) ELSs and germinal center (GC)-like structures forming in the spinal cords of EAE mice at peak phase (12–20 dpi, score 4–5). Arrows show CD35+ follicular dendritic cells. (F) Tfh-like cells infiltrated into the spinal cords of EAE mice at peak phase (12–20 dpi, score 4–5). (G) Tfh-like cells co-localized with B cells in the spinal cords of EAE mice at peak phase (12–20 dpi, score 4–5). Sections are representative of three mice analyzed. Bar = 100 μm.

