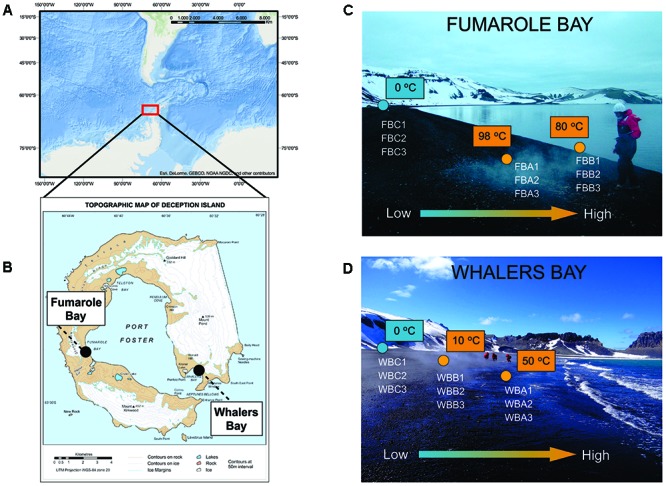
FIGURE 1.

Sampling map. Location of Antarctic Peninsula (A) and Deception Island, with Fumarole Bay and Whalers Bay (WB) geothermal sites highlighted (B). The map in (A) was generated using ESRI ArcGIS software. The map in (B) was courtesy of British Antarctic Survey. Distribution of collected samples across environmental gradients at studied geothermal sites is described in (C) for FB and (D) for WB. Values of in situ temperatures are represented in blue (glaciers) and orange (fumaroles). The arrow indicates the direction of low and high values of temperature, salinity, and volcanic compounds, as sulfate.
