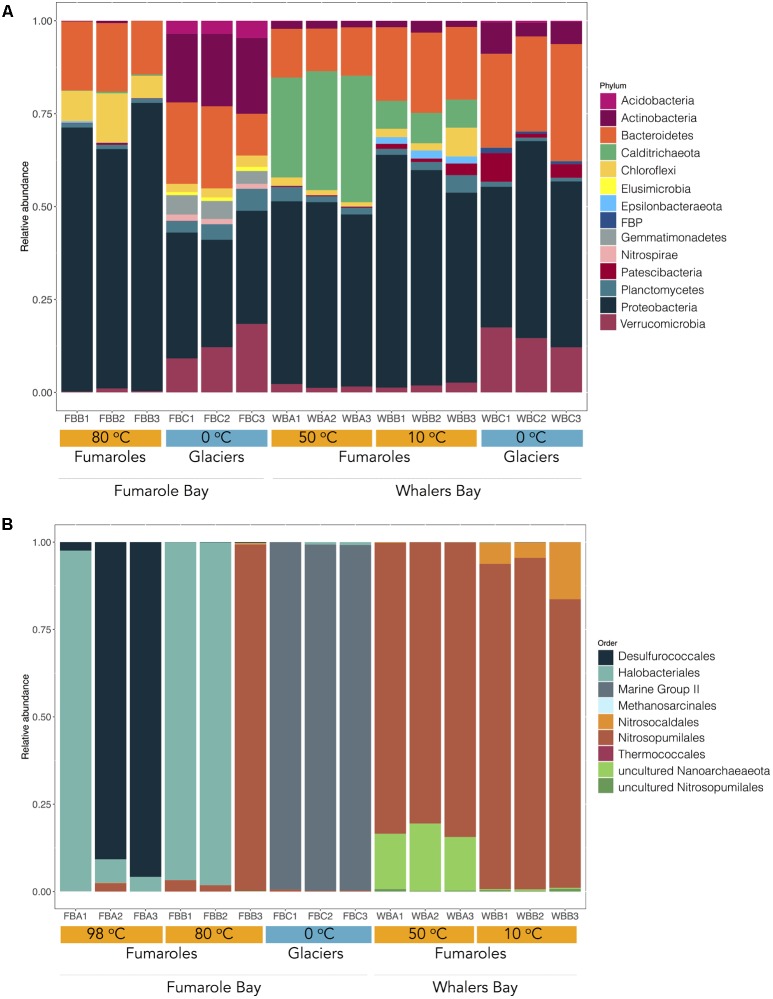
FIGURE 2.
Microbial community composition in fumaroles (orange) and glaciers (blue) on Deception Island. The figure shows the relative abundance of bacterial (A) and archaeal (B) taxonomic groups at phylum and order levels, respectively. Only bacterial phyla with more than 0.1% of abundance are represented. Environmental temperatures and geothermal sites of each sample are represented. Sequences were clustered at 97% similarity and taxonomy was assigned by performing BLAST searches against the Silva database v. 132 (E-value ≤ 1e–5).

