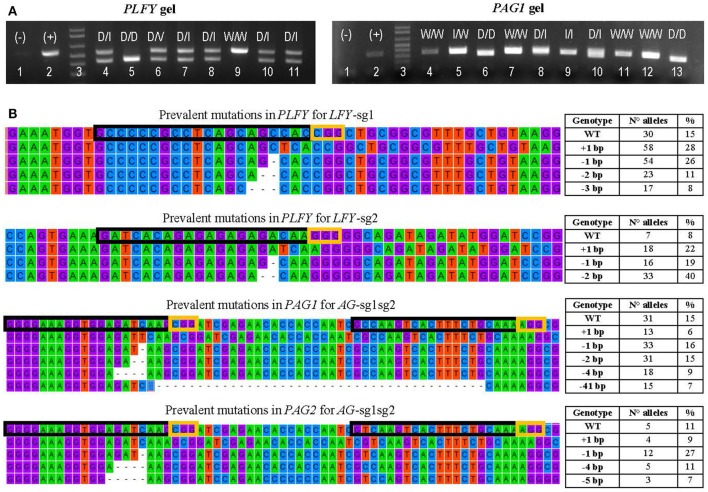
Figure 3.
Transformation event genotyping of LFY and AG paralogs. (A) Example of gels from PCRs of PLFY and PAG1 for insertion events with two sgRNAs. Symbols above each lane indicate the sequencing results of the DNA band(s). (+), positive control (–), negative control D, large deletion (16 or more base pairs); I, indel (insertion or deletion of 14 or fewer base pairs); V, inversion; W, wildtype. (B) Examples of the mutation types seen in alleles from mutants with one sgRNA in PLFY and two sgRNAs in PAG1 and PAG2. The top alignment shows the partial gene sequence of PLFY flanking LFY-sg1 in the coding region. The second from the top alignment shows the partial sequence of PLFY flanking LFY-sg2 in the promoter region. The third from the top alignment shows the partial sequence of PAG1 between AG-sg2 and AG-sg1. The bottom alignment shows the partial sequence of PAG2 between AG-sg2 and AG-sg1. The protospacer sequence (i.e., target site) is surrounded by a black box. The PAM sites are surrounded by a yellow box. The dashes indicate deleted base pairs. The tables on the right indicate the mutation seen in each row, the number of alleles with that mutation, and the percentage that the number represents in each group.

