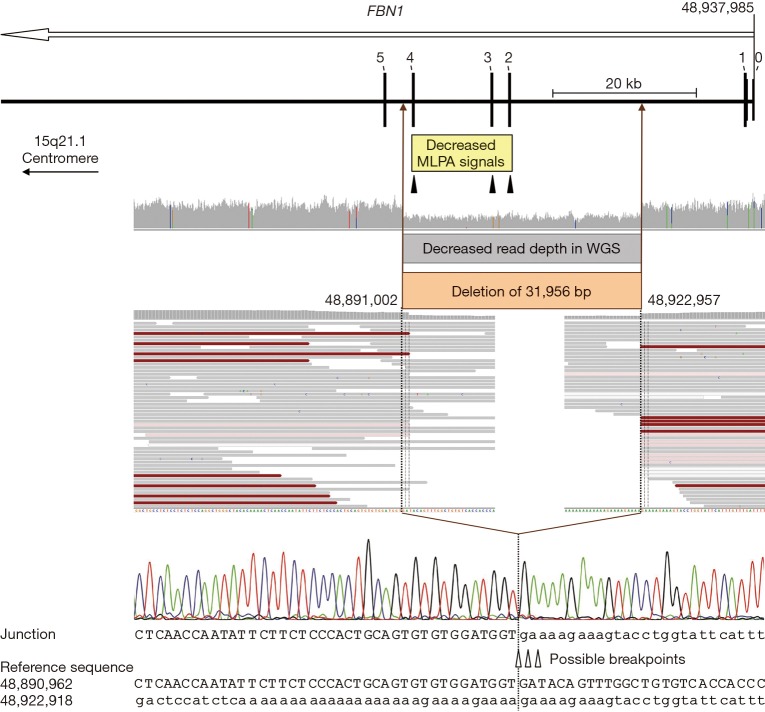
Figure 1.
Deletion characterization. Schematic representation of the 32-kb FBN1 deletion comprising coding exons 2-4 as well as an overview of the corresponding results of MLPA, WGS, and Sanger sequencing analyses. The open arrow below the gene name indicates the transcription direction. Exons are specified by bars and labeled with the corresponding number (non-coding exon 0 and the first five coding exons are indicated). The region with decreased normalized MLPA signals is indicated by a yellow box and the positions of the three MLPA probes located in exons 2-4 of FBN1 are marked by filled triangles. WGS data are displayed in the Integrative Genomics Viewer (IGV; http://software.broadinstitute.org/software/igv). Colored bars in the IGV coverage track indicate positions with ≥20% non-reference alleles; aligned reads are displayed as gray bars; red bars indicate read pairs with larger insert size than expected (due to the deletion); white and pale red bars indicate low quality reads. The region with decreased WGS read depth (i.e., the deleted region of the genomic DNA) is indicated by a gray and a brown box. Uppercase letters represent the sequence in the region of the deletion start point; lowercase letters represent the sequence in the region of the deletion end point. Due to identical sequences flanking the breakpoints, the break and re-joining could have occurred at three positions, as indicated by open triangles. The dotted lines mark the most 3’ possible breakpoints in FBN1 transcription direction (minus strand); note that the plus strand is displayed. Nucleotide positions are described in relation to the human genome reference sequence GRCh37. MLPA, multiplex ligation-dependent probe amplification; WGS, whole-genome sequencing.

