
Figure S2.
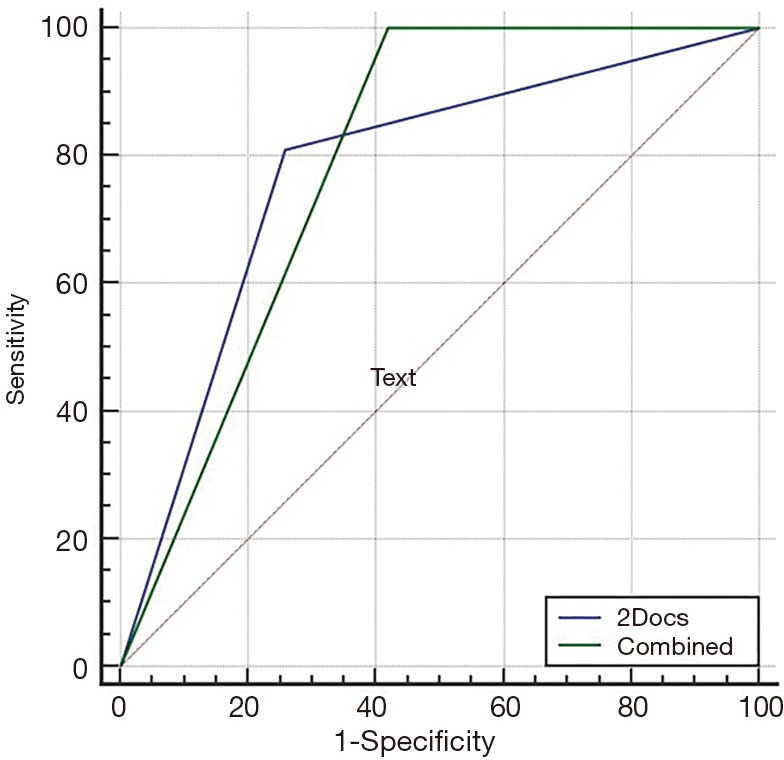
Pair-matched comparison of ROC curves to predict unstable plaque in patients with coronary artery disease. There was no significant difference to predict the unstable plaques between the optimal combined threshold (green solid line, indicating the presence of the napkin-ring sign and/or the plaque CT value of less than or equal to 53 HU) and the joint diagnosis by two radiologists (blue solid line) in terms of diagnostic performance (P=0.821, 95% CI: −0.107 to 0.135). [by MedCalc Statistical Software version 15.2.2 (MedCalc Software bvba, Ostend, Belgium)]. ROC, receiver operating characteristic.