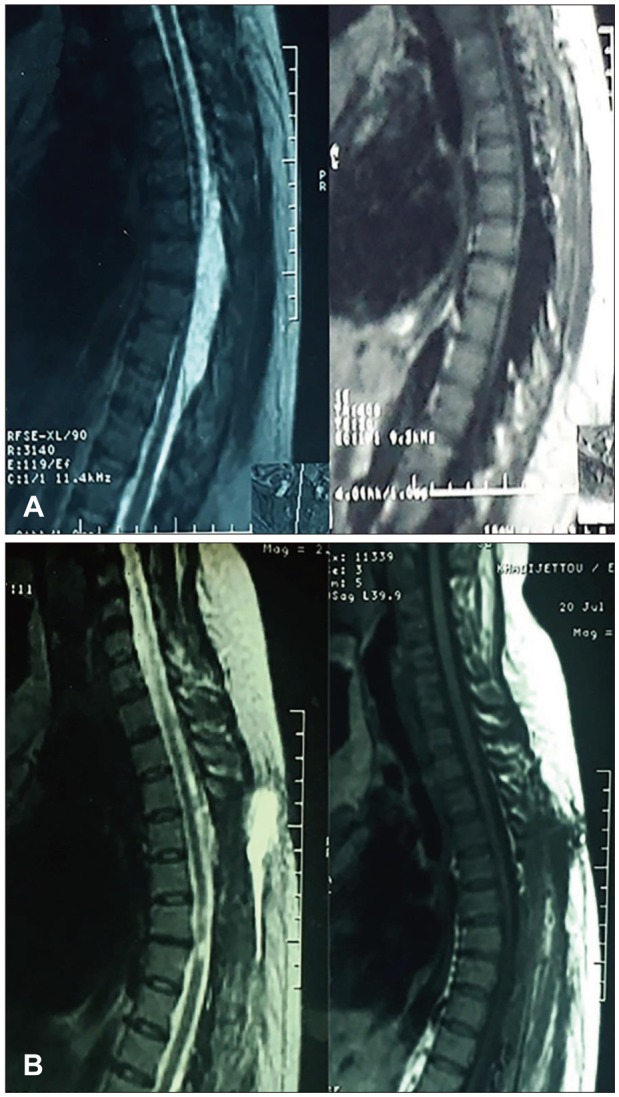
FIGURE 1. (A) Sagittal turbo spin echo (TSE) T2-weighted image (WI) and T1-WI magnetic resonance images showing at the T9 to T11 vertebral levels. Note the compression of the spinal cord. (B) Sagittal postoperative TSE T2-WI and T1-WI show total the spinal extradural arachnoid cysts.

