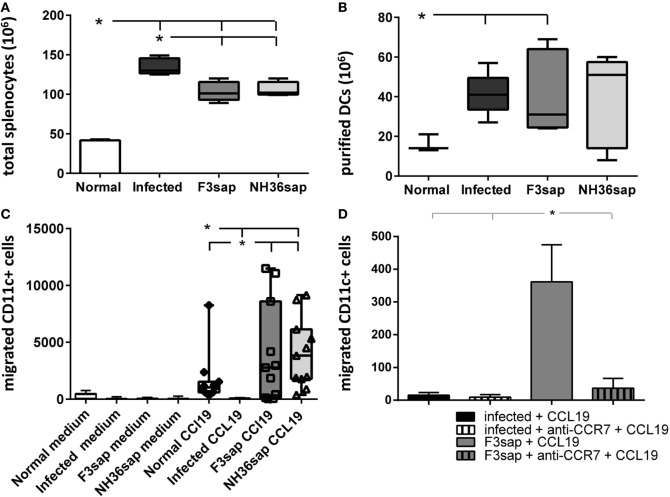
Figure 2.
F3- and NH36-primed dendritic cells (DCs) show enhanced migration response to CCL19 chemokine. Splenic DCs were purified from, normal, infected and F3, and NH36-vaccinated and Leishmania infantum chagasi-challenged mice. DCs were isolated at day 28 after challenge. The whiskers show the maximal and minimum values, and the top and bottom of the bars show respectively, the 75th and 25th percentiles. The 75th percentile is the value below which 75% of observations in a group of observations fall. (A) Total splenocytes. (B) Number of DCS purified by magnetic beads-affinity chromatography. (C) The chemotactic responses to 100 ηM CCL19 were assessed using a transwell system. After 2 h of incubation, migrated DCs were collected, stained using fluorescein isothiocyanate-conjugated anti-CD11c antibody, and counted by flow cytometry in a FacsCalibur apparatus (Becton Dickinson). In the boxes, the individual results for migrating DCs counts of normal mice (diamonds), F3-vaccinated (squares), and NH36-vaccinated mice (triangles). (D) Number of DCs from infected or F3-vaccinated and challenged mice, pre-incubated with anti-CCR7 antibody or no addition, which migrated toward CCL19. Results represent two-independent experiments (n = 5–6, mice per treatment in each experiment). Asterisks and horizontal lines show significant differences between treatments as disclosed by Mann–Whitney non-parametrical test.

