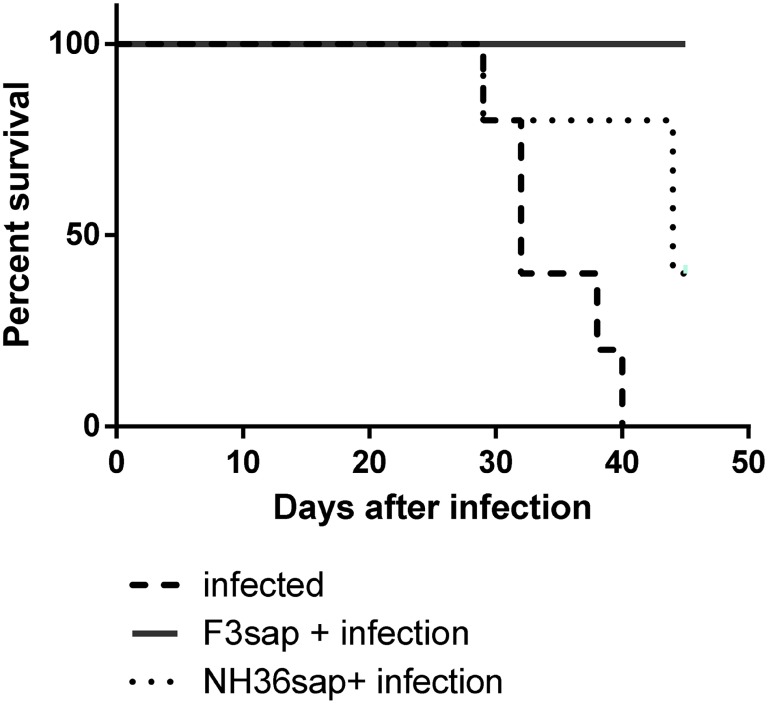
Figure 7.

Longevity of vaccine efficacies. The survivability of infected, F3sap, and NH36sap vaccinated and infected mice were recorded and represented using a Kaplan–Meir curve. Comparison of the survival distribution of infected controls and vaccinated and challenged mice, using the Log-rank Mantel–Cox and the Gehan–Breslow–Wilcoxon tests disclosed significant differences for the F3sap vaccine (p = 0.0018 and p = 0.0039, respectively). Differences between controls and the NH36sap vaccine were, however, only detected by the Log-rank Mantel–Cox (p = 0.0277).
