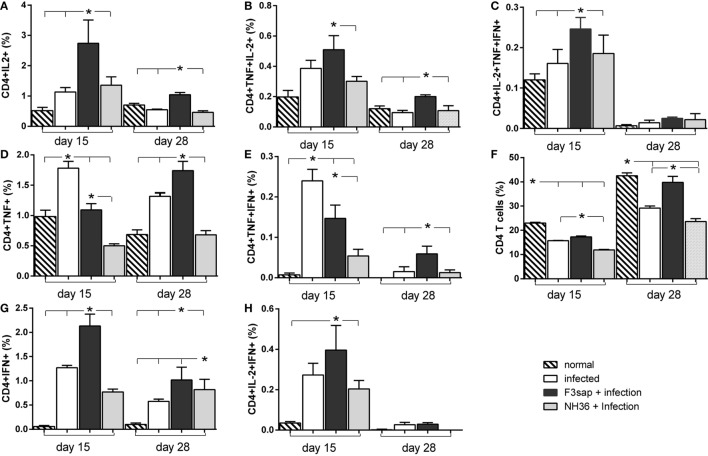
Figure 9.
Cytokines expressed by CD4+ T lymphocytes in response to NH36. Effect of the F3 and NH36-vaccines on the frequencies of CD4+IL-2+ (A), TNF-α+ (D), IFN-γ+ (G), TNF-α+IL-2+ (B), TNF-α+IFN-γ+ (E), IL-2+IFN-γ+ (H), and IL-2+TNF-α+IFN-γ+-secreting T cells (C) in response to the NH36 antigen, on day 15 and 28 post challenge. The total CD4+ T cell frequencies are also represented (F). Bars represent the mean + SE values of two-independent experiments (n = 5 mice per treatment in each experiment). Asterisks and horizontal lines show significant differences between treatments as disclosed by Mann–Whitney non-parametrical test.

