Figure 5.
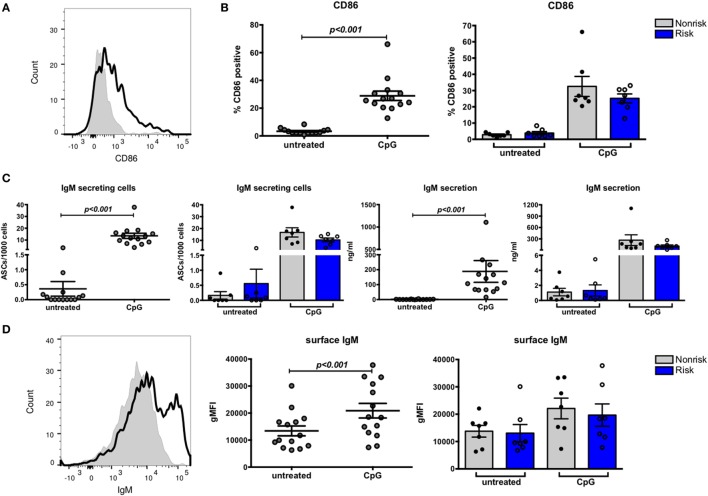
B cell stimulation results in upregulated CD86 expression and antibody-secreting cell (ASC) differentiation. Naive B cells were cultured for 4 days with or without CpG and analyzed by flow cytometry. (A) Representative histogram of CD86 expression on untreated (shaded peak) and CpG-treated (black outlined peak) B cells. (B) CD86 expression on B cells combined (left) and separated by haplotype (right). (C) ELISpot data showing proportion of ASCs combined (far left) and separated by haplotype (center left) and ELISA data showing IgM secretion by B cells combined (center right) and separated by haplotype (far right). (D) Representative histogram of surface IgM expressed on untreated (shaded peak) and CpG-treated (black outlined peak) B cells. Flow cytometric results of IgM expression on B cells combined (center) and separated by haplotype (right). p < 0.001 by Wilcoxon matched-pairs signed rank test [(B), left; (C), far left and center right; (D), center], p = ns by Mann–Whitney test for each treatment [(B), right; (C), center left and far right; (D), right].

