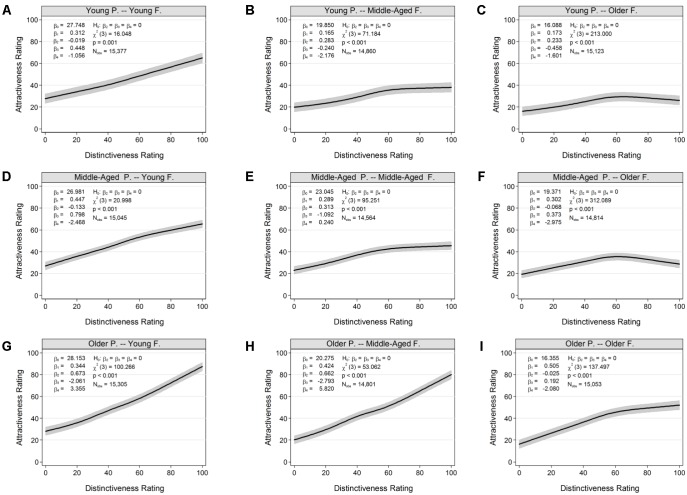
FIGURE 4.
Variations in the relation between attractiveness and distinctiveness ratings by age of perceiver and face: (A) Young Participants, Young Faces. (B) Young Participants, Middle-Aged Faces. (C) Young Participants, Older Faces. (D) Middle-Aged Participants, Young Faces. (E) Middle-Aged Participants, Middle-Aged Faces. (F) Middle-Aged Participants, Older Faces. (G) Older Participants, Young Faces. (H) Older Participants, Middle-Aged Faces. (I) Older Participants, Older Faces. Black lines show expected values of attractiveness, conditional on distinctiveness. Shaded areas indicate 95% confidence regions. Results were obtained from separate fits of multilevel restricted cubic spline models (Eq. 1). P = Perceiver; F = Faces.

